 Tweet
Tweet
Hi everyone
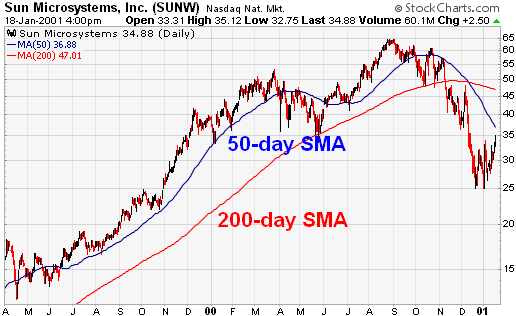
Can someone please explain the moving average feature in the charts to me a little? I’ve read the manual and did a bit of research but can’t quite get my head around it yet. How do I apply it to trading and what do the lines represent?
Any help and information would be appreciated
Thanks
Can someone please explain the moving average feature in the charts to me a little? I’ve read the manual and did a bit of research but can’t quite get my head around it yet. How do I apply it to trading and what do the lines represent?
Any help and information would be appreciated
Thanks

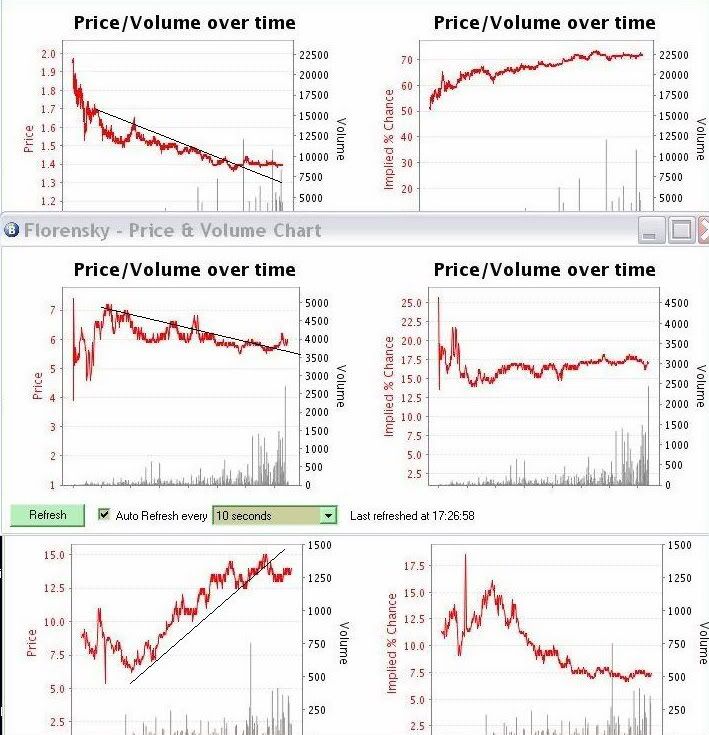
 , but is there a way to calculate the moving average, average, or whatever it may be, in regards to liability at odds, rather than simply the price traded.
 I am too slow
Comment